Manning's Roughness Coefficient
Manning's Roughness Coefficient Formula |
||
|
\( n \;=\; \dfrac{ 1.49 \cdot r_h^{0.66} \cdot S^{0.5} }{ v }\) (Manning's Roughness Coefficient) \( r_h \;=\; \left( \dfrac{ v \cdot n }{ 1.49 \cdot S^{0.5} } \right)^{ \frac{ 1 }{ 0.66 } } \) \( S \;=\; \left( \dfrac{ v \cdot n }{ 1.49 \cdot r_h^{0.66} } \right)^{ 2 } \) \( v \;=\; \dfrac{ 1.49 \cdot r_h^{0.66} \cdot S^{0.5} }{ n }\) |
||
| Symbol | English | Metric |
| \( n \) = Manning's Roughness Coefficient | \( dimensionless \) | - |
| \( r_h \) = Hydraulic Radius | \( ft \) | - |
| \( S \) = Channel Slope | \( ft \) | - |
| \( v \) = Flow Velocity in a Channel, Culvert, or Pipe | \( ft \;/\; sec\) | - |
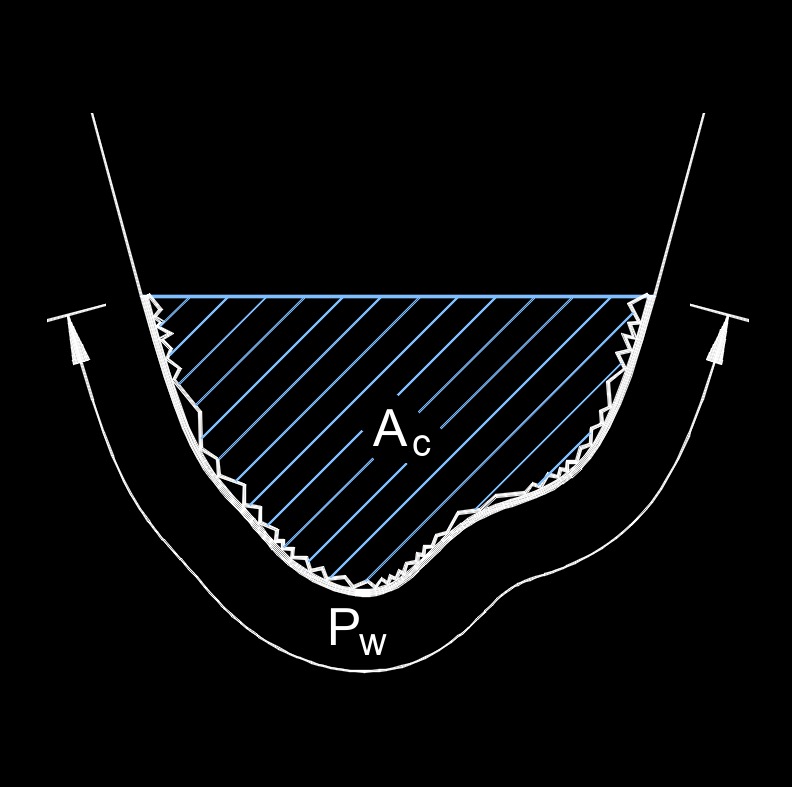
 Manning's roughness coefficient, abbreviated as n, also called Manning's coefficient, roughness coefficient, Manning's n or simply n, a dimensionless number, measures the roughness or frictional resistance exerted by a flow against the ground surface in an open channel, culvert or pipe. It quantifies the roughness or irregularities present on the channel's boundary, such as vegetation, rough walls, or sediment deposits, which affect the flow velocity and friction losses.
The coefficient varies depending on the type of channel, surface roughness, and other factors. It is often determined through empirical methods or reference tables that provide recommended values for different channel materials and conditions. For example, a smooth, well maintained concrete channel may have a lower Manning's roughness coefficient compared to a natural stream with vegetation and sediment.
By adjusting the Manning's roughness coefficient, engineers and hydrologists can account for the effects of channel roughness on flow velocity and accurately predict water levels, flow rates, and other hydraulic parameters in open-channel flow situations. The Manning roughness coefficient is one of the most important ways to describe the water flow over the ground surface. The roughness coefficient is used to calculate the friction factor using a Moody Diagram and the Reynolds number.

